
CCAFS: the CGIAR Research Program on Climate Change, Agriculture and Food Security
This global research for development program aims to reduce food insecurity under a changing climate, particularly for hundreds of millions of smallholder farmers who depend on agricultural activities.
We designed a website that would present their research stories, activities and results, publications, events and people; everything had to be easily browsable by research theme and region, including DSpace imported publications.
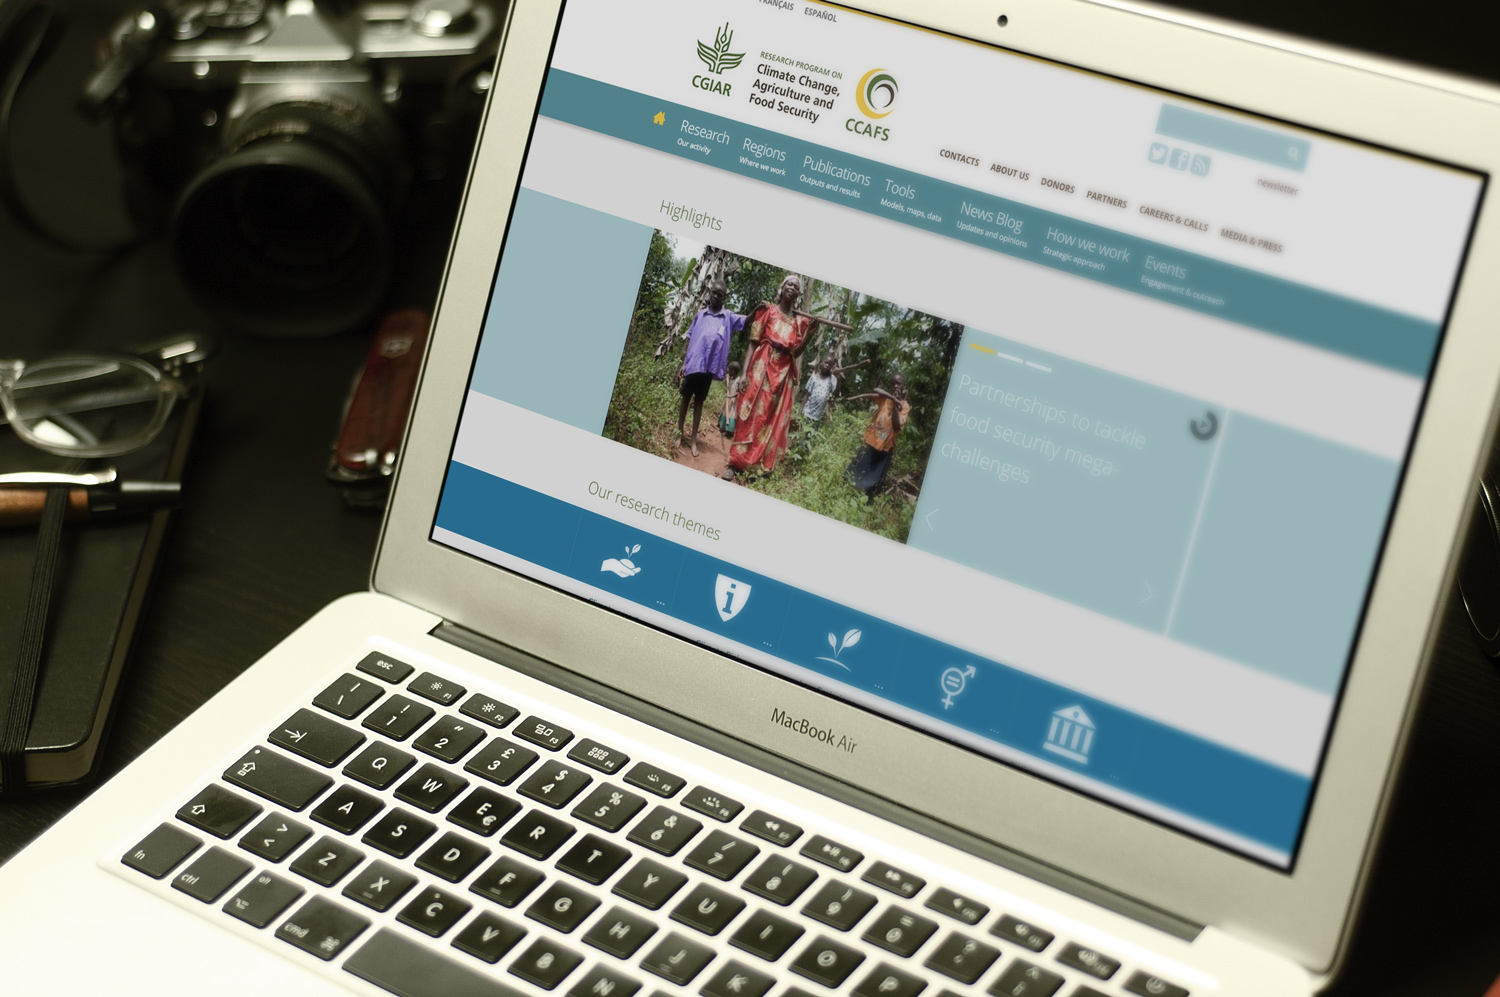
The home page
The front page had to represent both the vitality of the Program, featuring a selection of highlighted stories, and the pillars of CCAFS activity, as well as the regions of the world where the Program operates.
visit the website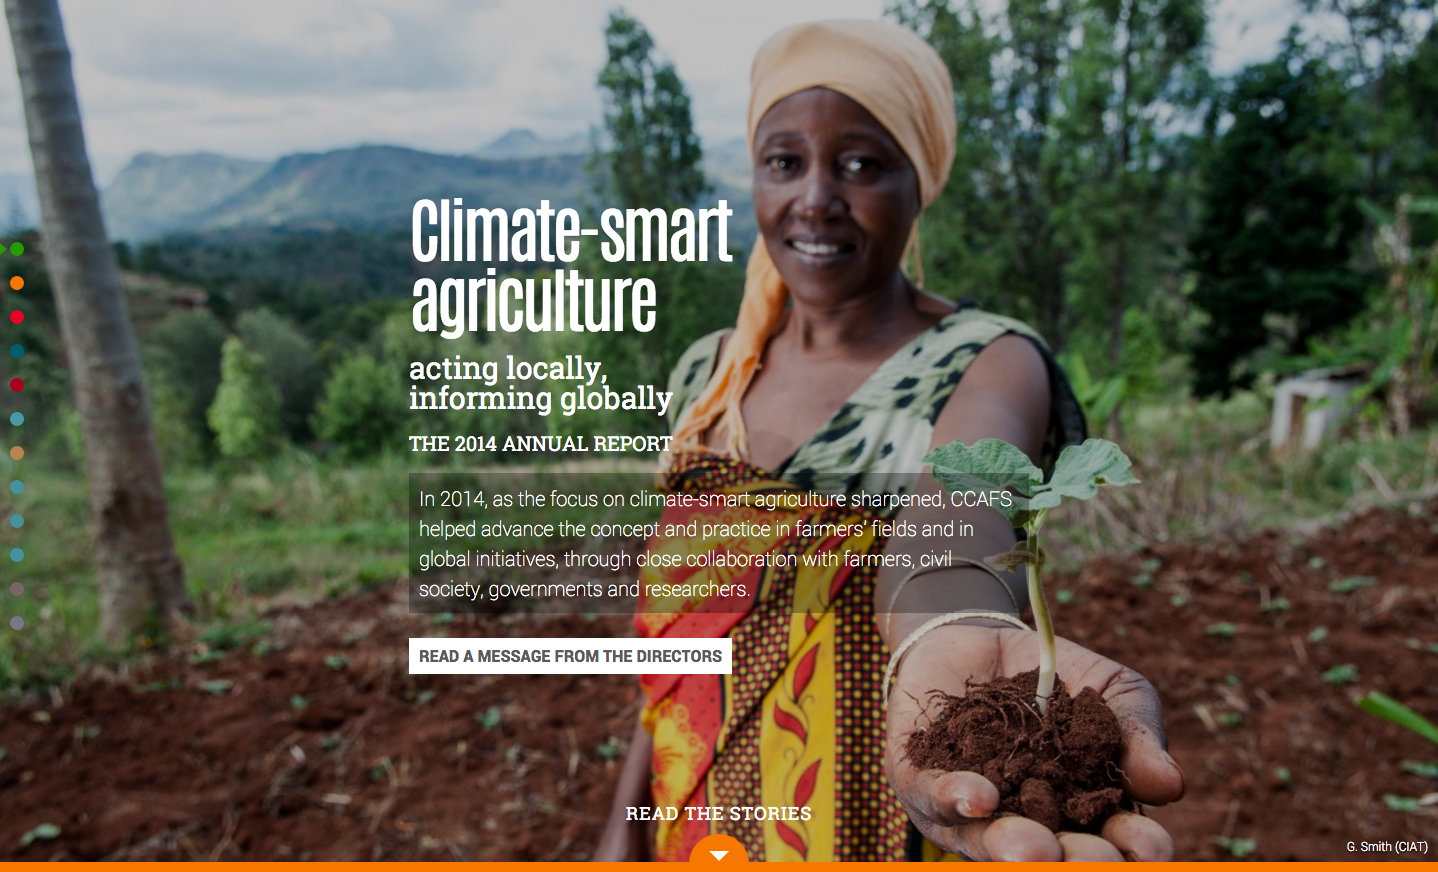
The 2014 Annual Report
In 2014 we went for a true single page report, that would make the whole browsing experience faster, with zero page reloads.
In order to preserve accessibility and proper Google indexing, we made the whole system work even without Javascript.
Visit the report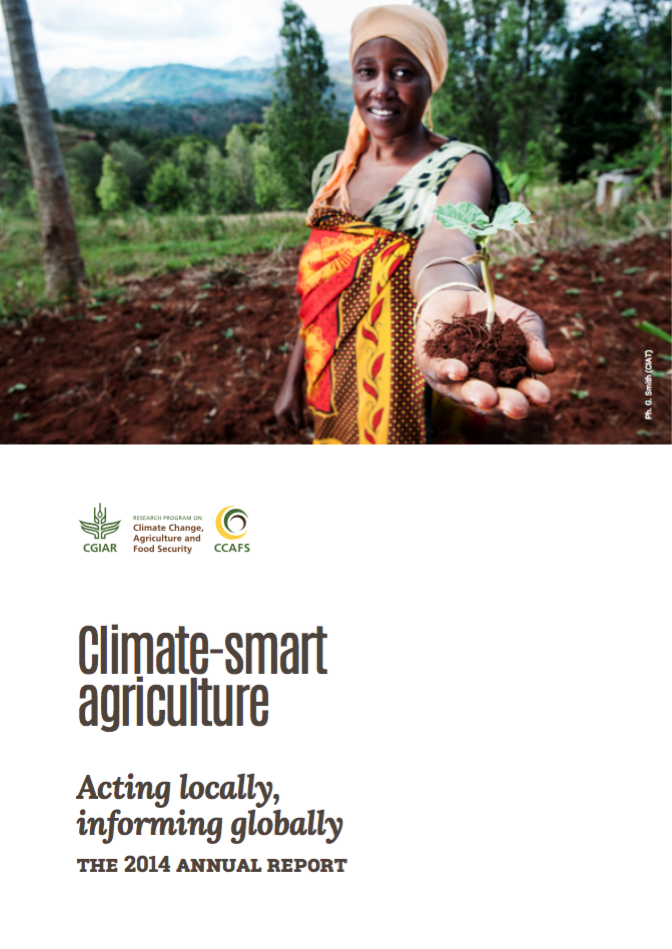
The 2014 annual report PDF version
For the second year CCAFS decided to be environmentally friendly and not print the report.
We still wanted to allow users to print selected parts of the report or download it for offline reading, for example on a tablet during flights.
We developed a custom system that generates a PDF directly from the stories uploaded in Drupal.
This approach has two major benefits: having the ability to generate an updated PDF version after any edit to the articles, and saving money on inDesign work, that is no longer needed.
Check out the PDF version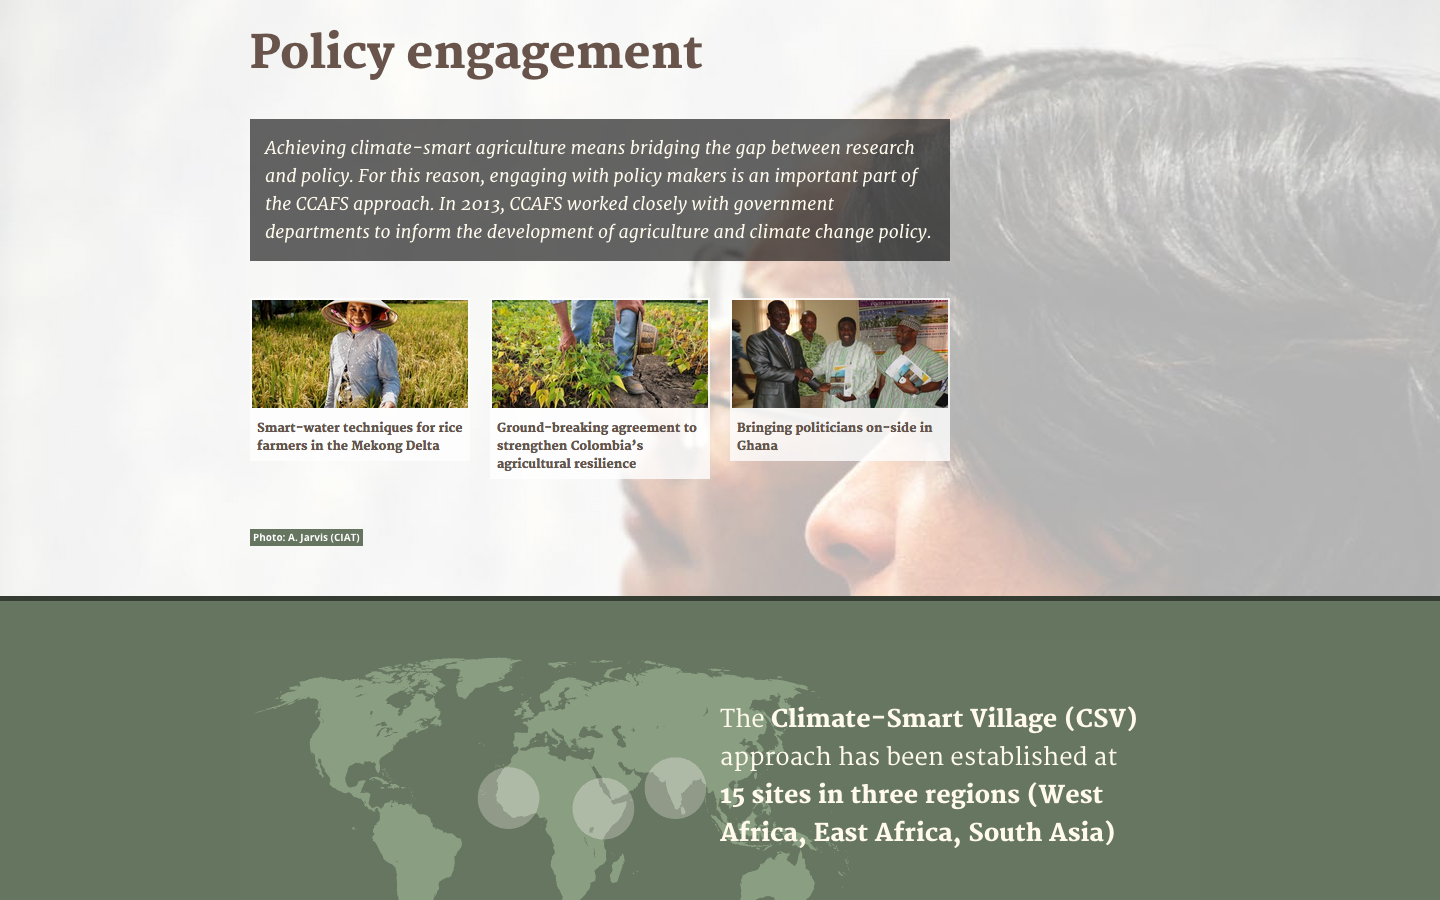
The 2013 Annual Report
We designed a custom system to handle the Annual Report stories, organized in chapters.
The system will support next years' reports too, allowing a different presentation for each year.
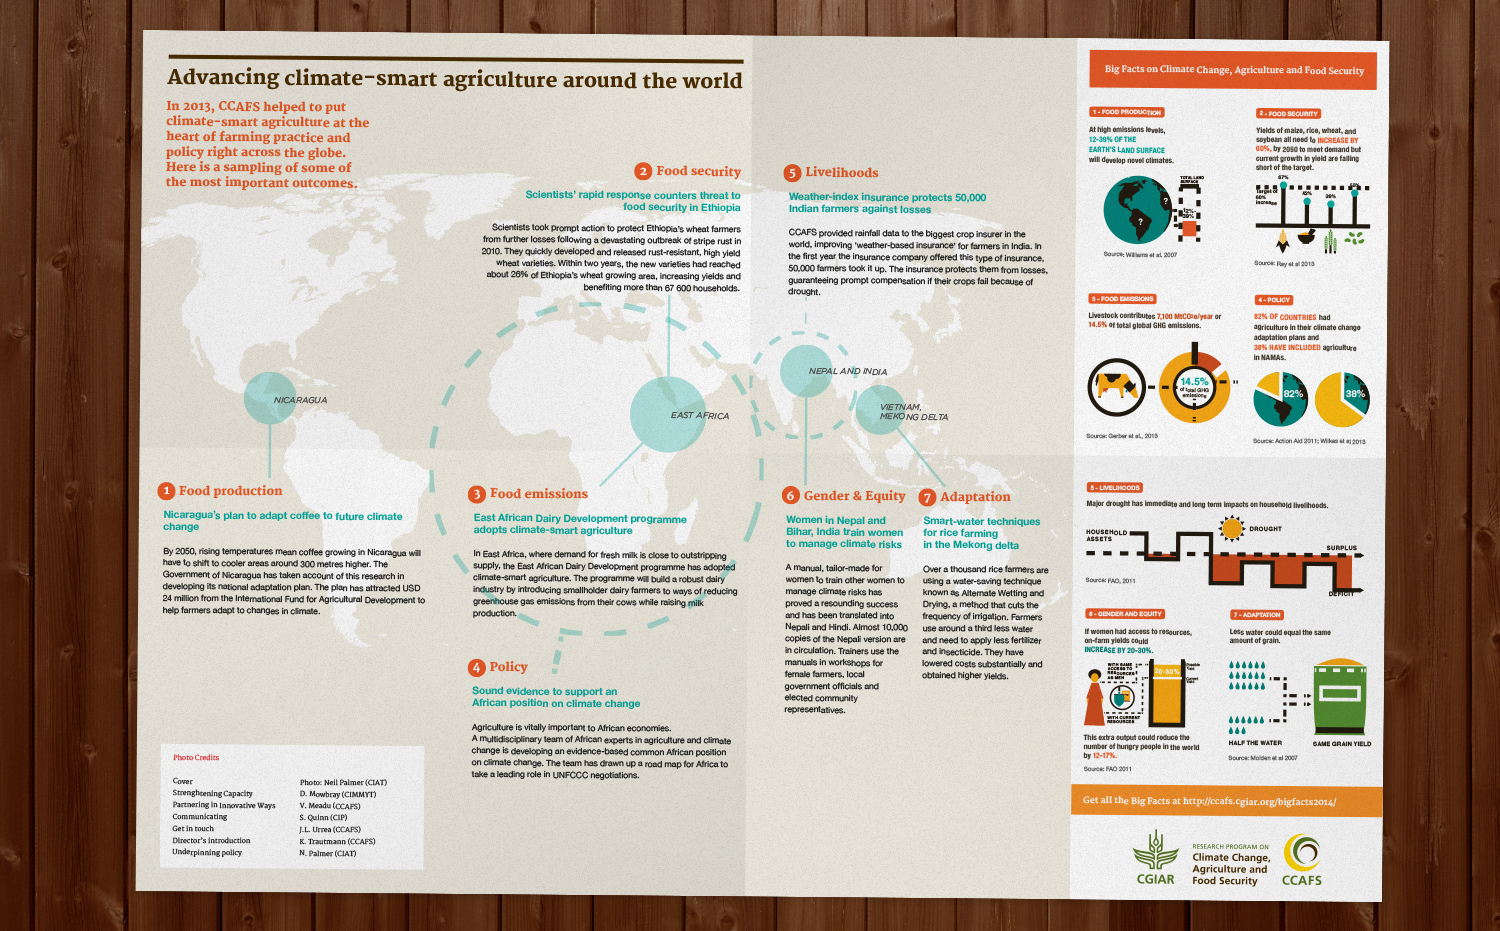
The 2013 Annual Report handout
CCAFS decided to not print the whole report.
We then designed a foldable handout that highlights the chapter of the annual report.
On the internal side we featured a map that highlighted each regions' top stories along with infographics that depicted the core data behind them.